
Data visualization is one of the critical parts of information analysis. It is used to assess efficiency, productivity, and strength in any area by clearly demonstrating indicators. At the same time, data visualization is used in businesses from public or non-profit sectors. In other words, it is an integral tool for evaluating the internal and external indicators of an enterprise, organization, department, and so on. That is why big data visualization software is in demand.
What is Data Visualization Software?
Let's take a closer look at what data visualization software is and consider its main advantages.
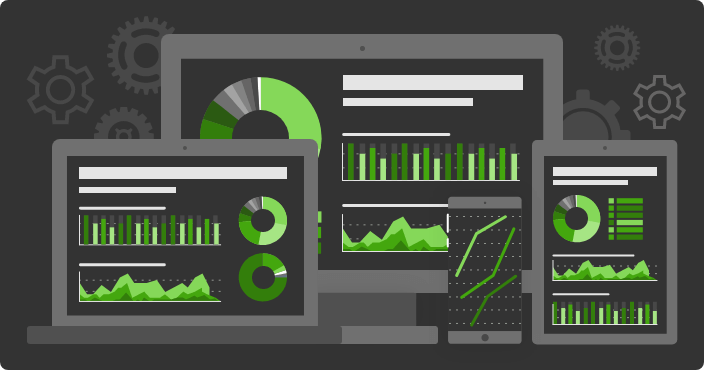
Data visualization software is a dashboard that turns metrics into a graphical representation, thereby tracking changes in key indicators, analyzing information, and displaying critical data points. Simply put, such an application processes data and displays it in the form of graphs, charts, tables, and so on, which allows even non-technical specialists to see the real picture of all business indicators. The data visualization panel is an indispensable tool for any analytics, whether it be the direction of marketing or production at a factory. This allows you to immediately see if the company is achieving its goals and make forecasts regarding future efficiency.
“By visualizing information, we turn it into a landscape that you can explore with your eyes. A sort of information map. And when you’re lost in information, an information map is kind of useful.”
– David McCandless, British data-journalist, writer, and information designer.
How Is Data Visualization Used?
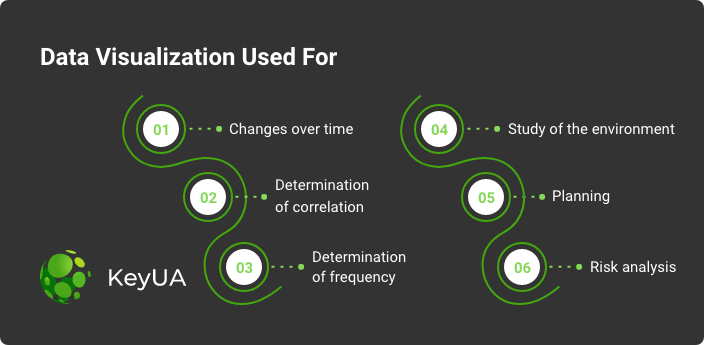
By and large, data visualization is not just graphs or tables. It is a broad-spectrum tool that helps you see the real picture of a wide range of cases. It is used in social media, music, production, marketing, sales, risk assessment, and much more. Here are some of the most common uses of data visualization:
Changes over time. This is perhaps the most common way to use data visualization. It is based on the fact that changes in indicators are reflected on a timeline, which allows you to see when the enterprise was successful and when there were growth delays or negative cases.
Determination of correlation. Revealing relationships is another important feature of data visualization. It helps to see the dependencies between indicators, as well as the relationship of data.
Determination of frequency. The frequency is also based on the use of time scales. Logically, it’s good to see the frequency with which events occur.
Study of the environment. Data visualization also helps a lot in market research. This is where marketers come on the scene, who can analyze the portrait of a potential user, the advantages and disadvantages of competitors, influential figures in the sector, etc.
Planning. The Gantt chart is used as a basis for planning in almost every industry. It is the must-have tool for planning and managing any project. And the data visualization dashboard builds it perfectly.
Risk analysis. Another application of data visualization is in the allocation of cost and risk. These are the indicators for which many nuances should be taken into account. Therefore their calculation can be very difficult. By constructing charts and tables, predicting risk can be made easier.
Common Types of Dashboards
Now that we know the software’s main goals, let's consider the various types of data visualization panels.
Marketing. These dashboards are designed to examine the effectiveness of your marketing campaigns, including SEO, email marketing, social media engagement, web traffic, and more. They allow you to track leads and measure how effective your sales funnel is.
Sales. These tools aim to accurately assess the results of both online and offline sales. You can analyze the performance of the whole team or each employee individually, including tracking lost deals, conversion rates, closing a deal, and so on. In general, sales dashboards allow you to see which sales areas are best to direct the team's efforts to achieve strategic goals.
Engineering. This type of dashboard assists engineers in creating and monitoring technical projects, software, and so on. Using data visualization tools, experts assess software productivity and security gaps and identify problems before they reach a large scale.
Executive. Another purpose of data visualization is to help make important decisions about business strategy and development. That is why senior managers also use these tools in their work.
Real-time. It is also worth noting that there are data visualization types that track metrics in real-time. Such applications are used on exchanges or where instant decision making is required.
Create a top-notch data visualization product that is 100% tailored to your business needs.
Build a ProjectData Visualization Software Examples
Data visualization allows you to make decisions about the future development of your business faster and more effectively. Unsurprisingly, the marketplace is overflowing with products that transform information into graphical representations. It is worth noting that data analysis is still the prerogative of business intelligence analysts (BI), but now there are lots of software that allow even beginners to start the assessment of indicators. Below, we'll take a look at some fairly effective products that can help even startups get into powerful analytics.
1. Tableau Public
It is one of the most popular data visualization tools used in business, art, politics, and so on. The product has been on the market for over 10 years, and its significant advantage is that it can analyze large amounts of information. Tableau is a free platform where anyone can transform their data into graphs, tables, and charts. According to the platform’s description, it allows you to create various layouts for data visualization, from simple graphs to creative and interactive visualizations.
2. Visme
This platform is designed for creating visualizations and preparing beautiful and creative presentations. Overall, this is a good tool for both analysts and budding designers. Visme makes it easy to create line charts, bar charts, pie charts, scatter charts, and many other chart styles. Its functions do a good job of visualizing cartographic data, arrays, tables, percentages, sensors, and more. Vism allows you to create graphic content for blogs, reports, presentations, and so on. Unlike Tableau, this software is not free and has a variety of monthly plans.
3. Infogram
It has a fairly simple tool that makes this product understandable for different groups and users. It has templates for over 30 different types of charts and maps and allows you to create infographics for social networks. Infogram is a web application with a user-friendly dashboard and a usable layout database that does a good job tracking company performance. In contrast to the previous tools, Informagram is a more narrowly focused product and is mainly suitable for small and medium-sized businesses.
4. Whatagraph
This data visualization tool is more focused on preparing analytics for social media, blogs, SEO, and email campaigns. It has integration with various systems, including Twitter and Google Analytics, which allows Whatagraph to collect data from all kinds of sources. The primary purpose of the app is to analyze metrics from marketing campaigns. It has several commercial offers for businesses of various sizes, from start-ups to mid-sized companies.
5. Sisense
This tool is business-oriented and helps to analyze various company's performance. It is designed to create dashboards to analyze large amounts of data. Its capabilities are aimed at helping large corporations in the healthcare and manufacturing sectors. Sisense allows you to create graphical representations of any type of data. Another significant advantage of this software is its intuitive interface, which significantly facilitates work with the product.
6. DataBox
It is useful software with various templates for diagrams, graphs, and so on. It's less robust than the previous apps but has a large database of layouts and colors. Another nuance is the ability to add interactivity and animation. DataBox allows you to create dashboards both on computers and smartphones. In addition, it's pretty good at analyzing data and also predicting business performance.
Main Benefits of Custom Information Visualization Software
As you can see, there are lots of ready-made solutions for data analysis and transmission into a graphical representation that can be found online. However, despite all of the benefits, it's worth remembering that they always work in a boilerplate. So they often fail to meet specific business analytics needs. Here are some of the main reasons why building custom data visualization software is the best option:
1. Visualize multiple metrics at once.
Many companies use various third-party services to analyze their performance, such as marketing dashboard, automation platforms, CRM tools, etc. In general, this is not always convenient, as it requires additional time to bring together data from different sources. Therefore, having a custom data visualization dashboard to immediately calculate and renew all your necessary indicators is a more optimal and efficient way. Besides, you can fully customize it to your business needs, thereby providing a more in-depth analysis of the data and a better understanding of what areas you need to improve the company's performance.
2. Make data more accessible.
The customizable toolbar will give you more information on important metrics. You don't need to be a technical expert or a specialist in marketing, sales, etc., to evaluate the results obtained. Any user can quickly process data and also analyze their graphical representation. You can easily get answers to essential business questions based on the capabilities of custom data representation apps.
3. Strengthen collaborations.
Custom products improve the work of the team since you can customize your software to be based on meeting collaboration needs. Updating data in real-time, sharing charts and tables with colleagues, quickly changing charts, and distributing them with everyone - these are just a small part of what you can do with the whole team, regardless of the browsers or operating systems used. Create links to your dashboards and reports, so they are instantly available to all stakeholders.
4. Create reports in a few clicks.
Since the business situation can change quickly, you should be able to generate reports instantly wherever you are. Custom software can also be integrated with your internal databases or messengers, making it easy to create reports. You can take all the necessary data from your internal system, generate charts and reports in a custom panel for data visualization, and then share the necessary documents through your internal system again or by email.
5. Create unique templates.
Making a custom data visualization tool allows you to create business analytics and presentations in any convenient format and add interactivity. You will be able to create charts and reports that fully satisfy the needs of your business. Besides, it can also customize the software for your own needs and provide it with extended functionality that ready-made solutions often do not have.
Partner with trusted KeyUA developers to create a product that makes your analytics more efficient and accessible.
Contact UsHow to Build Data Visualization Software
Since the benefits of developing a custom web-based data visualization system are significant, let's consider the main steps of project implementation.
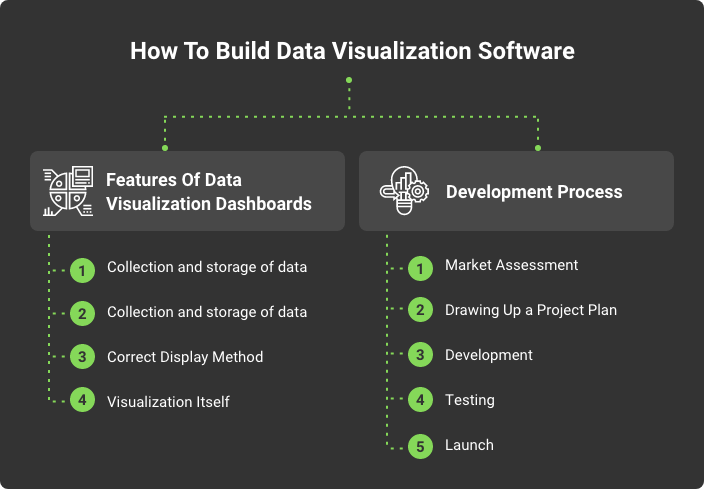
Main Features of Data Visualization Dashboards
Before you start developing, you need to make sure that you have a technical description of what you want to get. Here is an example of the essential features a software should have:
1. Collection and storage of data.
One of the most important features of an application for graphical information transformation is collecting correct data and its subsequent storage. For some companies, this can be a real challenge. If the information needed for the analysis is on the Internet, then the application should be able to collect it correctly, excluding garbage and unnecessary data. Reliable open source tools are used To implement such projects, such as Python, Ruby, PHP. Another nuance of such software is the presence of a parser, which recognizes information in accordance with pre-created templates, collects it, and stores it in the database.
Companies don't always need data only from the Internet. They can also have internal databases based on which it's necessary to carry out the analysis. Sometimes the data volumes can be too large, so it is worth taking care of big data visualization software development in advance.
The next important nuance is the ability to delete it, especially when it comes to data from the Internet. The system must correctly sort the data, determining essential information from the noise that should not be stored in the database.
2. Select and Process Information
Working with large amounts of data, you need to realize that not all is needed for visualization. In this way, the system should be able to separate those indicators that need to be combined into diagrams from all other information. It should also be noted that large volumes will only slow down the graphing and analysis process. The correct sorting and selection of data is a vital functionality that will further affect the productivity of the software.
3. Correct Display Method
How your data will be displayed on the screen is essential for analysis. Good software should be able to cost line, area, bar, bubble, pie charts, tables, graphs, histograms, scatter plot, gauge, map, and so on. Additional visualization tools to make the report more understandable and colorful are also welcome. React and Angular are excellent frontend programming languages for developing such elements.
4. Visualization Itself
Here we are specifically talking about how graphs and diagrams will look, their color schemes, construction effects, and so on. It is up to the designers to think carefully about the layouts for displaying data so that the end-user understands and recognizes what is displayed on the screen, and it is pleasant to work with.
Development Process
Now we will go directly to the steps that need to be taken to create software for data visualization.
1. Market Assessment
If you want to create software for the company’s internal purposes, then at this stage, you need to determine what tasks the application should solve. In accordance with this, you need to prepare a project specification. If you want to create an application for commercial purposes like SaaS, then you need to conduct a market analysis, including a detailed study of competitors and their possibilities, analysis of your potential customers, as well as technologies that are best used in this case, for example, cloud-based solutions.
2. Drawing Up a Project Plan
The next step is to create a project plan that will display how long it takes to complete each task. The plan will also show the total time predicted to build the product. Usually, this is what a development team must do. They describe in detail how much time is needed to deliver each functionality from the specification.
3. Development
The next most time-consuming part of the process is building the project architecture and writing the code. This usually takes at least a few months, but the time depends on the project’s complexity and characteristics.
4. Testing
The next step is equally important, as it consists of verifying the product’s functionality before it becomes available for use. This process assumes that the quality assurance professional will compare the product’s actual functionality with the expected result. This step helps identify any system problems and bugs that can be corrected before the product is available to the end-user.
5. Launch
Next is the exciting stage of the product launch onto the market. Once the software has been rigorously tested and verified that it works as expected, it's time to launch your marketing campaign and let users try your great product.
Cost to Develop Data Visualization Software
The price of custom software building depends on what kind of cooperation you prefer and who will work on the project.
In-house Development Department
If you wish, you can create your own department of developers who will work in your office and direct their efforts to create a product. Its obvious advantage is that the team will always be somewhere nearby; however, this is the most expensive way. In-house software developers in the US charge an average of $75-$100 per hour. Another disadvantage is that you will have to select the personnel yourself, which will take time. In general, you will need at least one month to form a development team.
Outsourcing Agency
These are companies located in another country or even on another continent that provide full product development, including design, code writing, testing, and even preparing a marketing campaign. In general, this is the most profitable type of cooperation, since such companies offer a wide range of services and you do not have to worry about staff recruitment. After you sign the development contract, the team is ready to start working on your project immediately. Depending on the company’s experience, capabilities, and location, you can expect to pay $25-$75 per hour.
Freelancers
This is a way to save a little. But here again, you will have to interview and hire each developer separately and be responsible for setting up and maintaining the communication on the project. Freelancers in the US charge $50-$75 per hour, while those in Asia expect about $15 per hour.
Wrapping Up
Data visualization is an effective way to improve your business and formulate strategic goals. Data analysis is a cumbersome and time-consuming process, and data visualization is aimed at making it easier. That is why many ready-made solutions on the Internet offer various options for building graphs, charts, and tables. But unfortunately, all of them work according to a given template and do not always provide an opportunity to customize data visualization for business needs. In such cases, the most productive solution is custom data visualization software development.
You can discuss all your wishes with the development team and create a unique product that will make your analytics even more powerful.
Do you want to know the exact cost of developing your project? Just contact our specialists and get a free consultation.
Contact Us


 Unit 1505 124 City Road, London, United Kingdom, EC1V 2NX

Comments
Leave a comment