Today’s software development management is highly targeted at compromising customer expectations and the team’s performance, motivation, and progress. Designing a high-quality software product greatly depends on the correct set of software development KPIs with accurate analytics on every stage.
The traditional approaches mainly rely on quantitative metrics like the number of code lines, bugs, and meeting deadlines. Modern agile methodology implies analyzing processes and operational metrics to optimize the qualitative parameters.
Find out the main types of key performance indicators for software developers and how they help measure their performance.
Why Do KPI Engineering Metrics Matter?
Some teams still rely on gut instincts when setting a workflow and managing processes within the project development. The lack of a systematic approach to planning and measuring success often leads to sudden failures like the inability to close a specific issue or complete a particular development task by the set deadline. Why does it occur? What factors lead to losses? How to help your team succeed? If you don’t know the answers to these questions, it will be tough to explain them to a client and engage your team to move on.
To foreclose the possibility of unexpected failures, the team needs clear-cut indicators to achieve the client’s business goals and control your inner processes in the course of development. Each key performance indicator (KPI) helps evaluate the software team's productivity, understand if it is doing its best, and plan resources to increase efficiency.
The Types of Software Metrics
The full diversity of existing KPI engineering metrics can be divided into five groups:
- Formal code metrics: These are metrics for evaluating the code quality, mainly used to ensure consistency between different developers in the team. This group includes Lines of Code (LOC), Instruction Path Length (IPL), code complexity, etc. In modern development, formal code metrics are considered less valuable. Writing lots of code doesn't always mean higher final product quality or better team performance.
- Software developer productivity metrics: They help analyze each developer’s input by assessing how much time and effort individuals invest in the project development. The most popular metrics include velocity, cycle, and lead time.
- Test metrics: The quality and comprehensiveness of testing affect the product quality. Test metrics like code coverage, automated tests percentage, and production defects measure how effectively the product is tested.
- Operational metrics:They are used to analyze the software's stability in production and maintenance efficacy. This class's prime metrics are Mean Time Between Failures (MTBF) and Mean Time to Recover (MTTR).
- Customer satisfaction: They demonstrate how successfully customers interact with the software if they are satisfied with the product. The critical customer satisfaction metrics are Net Promoter Score (NPS), Customer Satisfaction Score (CSAT), and Customer Effort Score (CES).
You need to understand the central concept: metrics are functions, not measurements. These two terms are often used as synonyms. By setting a specific metric, you can foresee future performance.
Benefits of Software Development Metrics
In the context of project management, setting software metrics helps:
- Characterizeto understand all processes, resources, and environments for software product development.
- Evaluate to determine the current project status concerning plans and goals.
- Predict through understanding the multiple relationships between processes and products and model these relationships for future phases.
- Improve by detecting inefficiencies, roadblocks, and other failure triggers and finding ways to eliminate them.
Translating all these project management capabilities to the business language, you as a client can highly benefit from setting reasonable KPI for developers, as it results in:
- Reducing costs;
- Reducing overtime;
- Increasing Return on Investment (ROI);
- Optimizing workloads management;
- Identifying areas of improvement.
Key Guidelines for Software Metrics Use
Now it is possible to collect enormous amounts of data automatically. At first glance, you may think the more metrics, the better. However, team management runs the risk of collecting too much data with a poor impact on the final result. The way software metrics are collected, calculated, and reported is not an issue nowadays. The more important aspect is how to use them correctly. Patric Kua, a tech principal, the author of “The Retrospective Handbook: A guide for agile teams,” has described four guidelines for correct software metrics use.
1. Link software metrics to goals
Each metric you’re using should be related to a goal. For instance, the development team can focus on clear objectives, such as reducing the number of reported bugs, accelerating the task's completion, or reducing the amount of code. Focusing on metrics as targets helps developers understand the requirements better and follow them to improve the software quality and user experience.
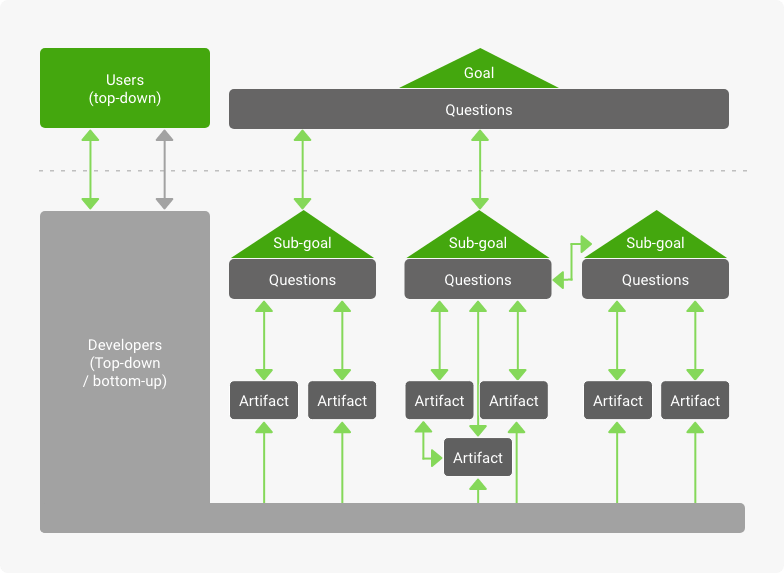
Goal-Driven Software Development Process
2. Track trends instead of numbers
A metric is a function that can be generated based on regular measurements or set by default as the development process's target. In every short period, it is easy to declare success if the target metric value is met. However, it is not informative in terms of the entire process. It is much more critical for the result to observe the changes and define the general tendency. Analyzing in what direction the trend line is moving can say more about the process. It also makes sense to see the effect of any changes made to the process.
3. Measure in shorter periods
Developers prefer not to interrupt their work often to see if they have succeeded or failed. However, breaking the measurement periods into smaller time frames helps determine the progress more accurately. Smaller periods give more data points that are useful for research. For instance, metrics can show a particular problem on the go and prevent significant failures in the future. You can set new tactics for a team when something goes wrong to improve productivity before something terrible happens.
4. Skip using metrics that do not lead to change
If you see that some project metrics do not change with time and do not give any valuable insights for reaching your team goals, just stop using them. There is no sense in repeating the same work if it doesn't get your team closer to the desired result. Having such situations suggests that maybe you’ve chosen metrics that have no value to your specific project and don’t drive progress towards the set goals. It’s time to select other KPIs for the software development team that will provide you with consistent progress indicators.
Not sure what software development KPIs would be reasonable for your project? Consult the KeyUA experts to set the right metrics to meet your goals.
Contact UsTOP KPIs for Software Development Companies
There is no standard set of metrics that all development teams can effectively use. Depending on each development project's individual goals and specificity, management sets specific KPIs for proper progress control. As a start, here are the most popular metrics used in today’s environment.
1. Lead Time
Lead time is one of the traditional agile KPIs used to evaluate how long it takes for a team to turn an idea into an actual product. In other words, it measures the time required to process the task from the moment when it appears to the delivery of the completed result. Assuming that a team is customer-responsive, struggling to push the code to production as soon as possible, it makes sense to lower the lead time continuously. Usually, this is done by reducing the decision-making chain.
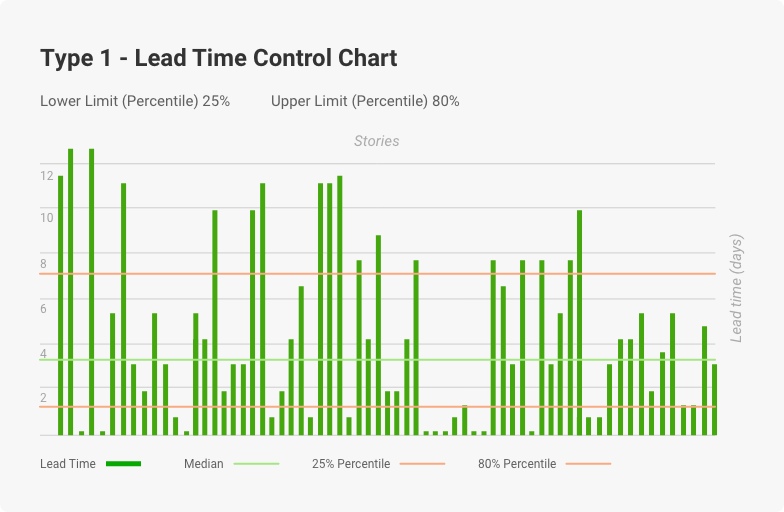
Lead Time Control Chart
Here you can see how much time in days was spent on completing each story. The metric sets upper and lower control limits (red lines). Falling out of the limits indicates there was some problem that should be revealed and discussed.
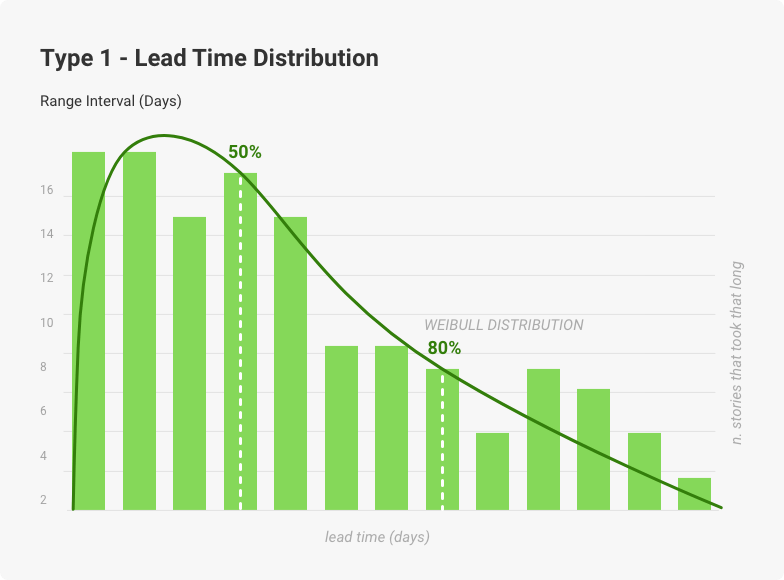
Lead Time Distribution Chart
The Lead Time metric helps visualize the trends and predict how long the following story is likely to take. To calculate the probability, you can generate a lead time distribution diagram.
2. Cycle Time
Cycle time is a part of the Lead time, and it shows how much time a developer has actually worked on its execution.
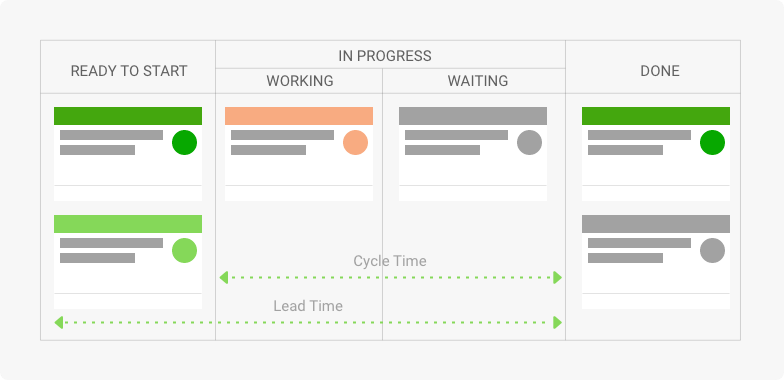
Cycle Time vs. Lead Time
Let’s say your team is using Kanban methodology for task management. When a new assignment appears on the Kanban board, it requires reviewing and discussing before the execution starts. Moreover, a task spends some time in the waiting queue before a developer picks it up and starts working on it.
Cycle Time covers when the new task appears in the 'In Progress' stage and gets to the ‘Done’ column.
3. Team Velocity
Team velocity shows how many software units (tasks, features, story points, etc.) are completed in one sprint or iteration. Using this KPI development metric is controversial. It should not be used to compare different teams because the performance and development speed requirements are individual for each one. However, if used internally, it helps to program sprints and analyze the team’s output to make projections regarding how much a team is capable of achieving in the next sprints.
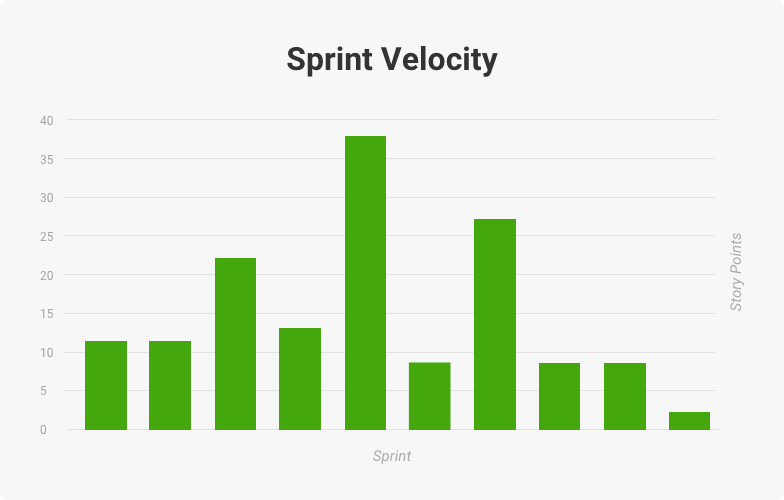
Here is an Example of a Team Velocity Diagram
If you check the chart above, the team has completed 11, 11, and 17 story points within the first three sprints. The average velocity is 13. It is the expected team output for the next sprints.
4. Active Days
The Active Days metric measures the time required for a developer to build a product. It doesn’t include the time for preparation, discussing tasks, and other things. It is only the time of actual code development. This metric is not used for planning or administration purposes. It serves to observe the hidden costs of interruptions. For instance, it shows how the meeting in the middle of the workweek can affect the overall developer’s productivity.
5. Release Burndown
Release burndown helps understand how much of the work scope remains to be completed within the next sprints and how much time is required.
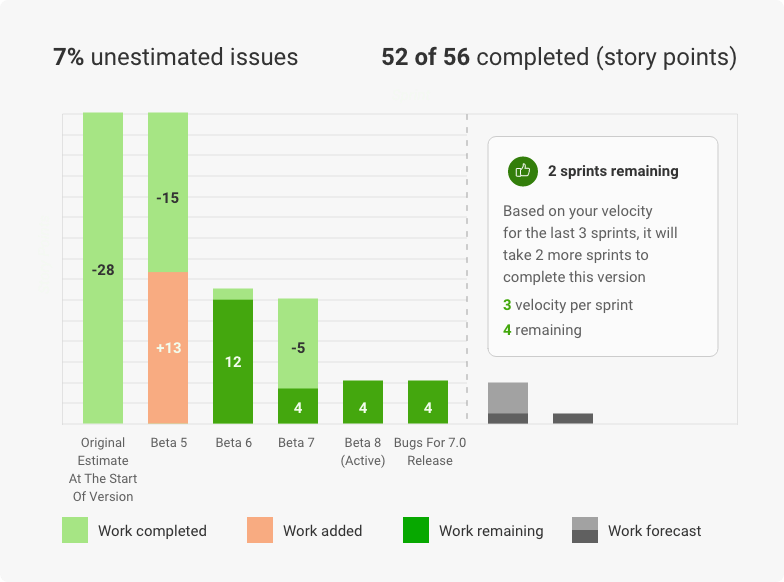
One Example of a Release Burndown Chart
This Release burndown chart shows the amount of work completed, added, and remaining. The grey part is the projected number of sprints left to complete the job.
6. Code Churn
The Code Churn metric reflects how many code lines were added, edited, or deleted within a certain period. It is usually measured in lines of code (LOC). It allows software managers to monitor the development process and the quality of developers’ work. If the churn begins to rise, it can be a sign of a problem that needs attention.
Code churn doesn’t stay stable over a project lifespan. It is normal to have a high churn when the project begins. It is commonly called an ‘exploratory’ churn. It characterizes the period when software engineers explore various potential solutions to a problem. Then the Churn gets lower after the solution is chosen and further refined.
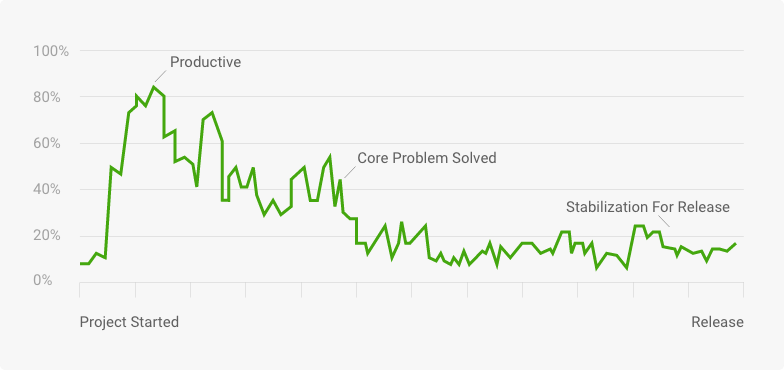
Code Churn Diagram
7. MTBF and MTTR
The mean time between failures (MTBF) and mean time to recover/repair (MTTR) measure the production environment's software performance. Software failures are almost inevitable, and these metrics help control how well the software recovers from them. These are the key metrics to evaluate the efficiency of maintenance staff.
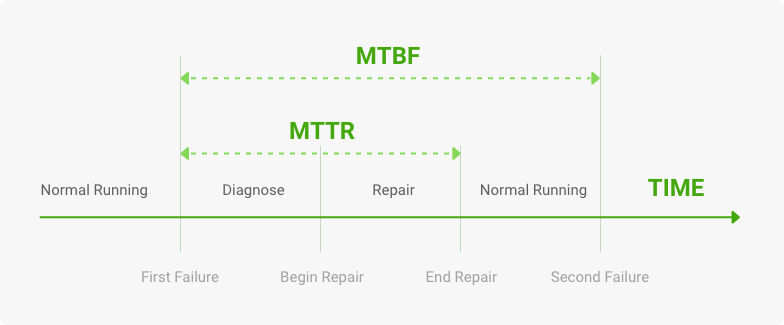
MTBF and MTTR Relation
8. Escaped Defects
This software development KPI is used to measure the quality of the delivered code. It shows how many defects (bugs) were detected after the code release. You can capture it per release, sprint, month, week, or another time frame, depending on the project needs.
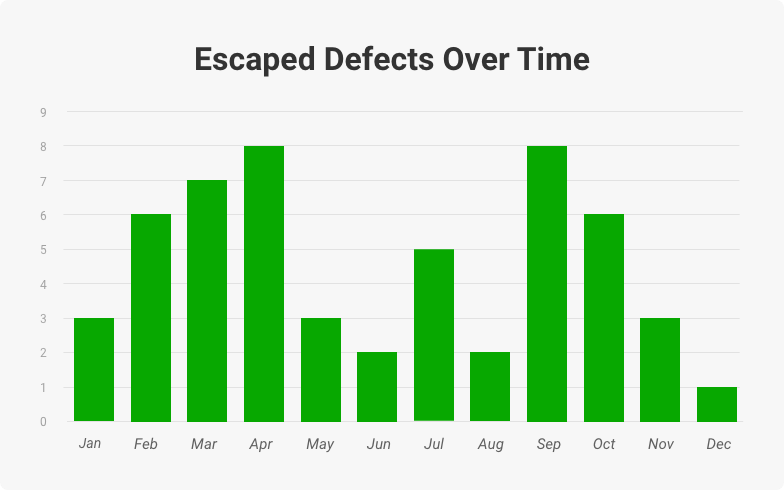
This Chart Shows Escaped Defects over Time
An increasing escaped defects number points to a flawed quality process and can signal that code requirements should be reconsidered before releasing.
9. Defect Removal Efficiency (DRE)
This metric measures how many defects were found by the end-user after the product delivery (D) compared to the bugs found before the delivery (E).
Each project aims for DRE=1. The closer to 1 DRE, the fewer defects were revealed by the end-users. Often it is calculated in percentage. DRE of 85% and higher is considered to be a good DRE score. A team can reach a DRE of around 95% by adopting a comprehensive inspection process and precise requirements.
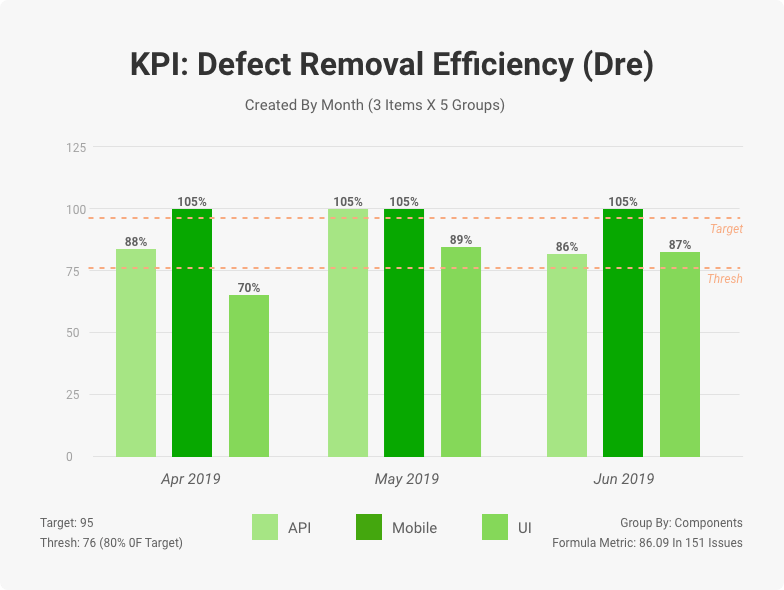
Defect Removal Efficiency (DRE)
10. Net Promoter Score (NPS)
A Net Promoter Score (NPS) is used to assess customer satisfaction with the software product after it has gone to the public.
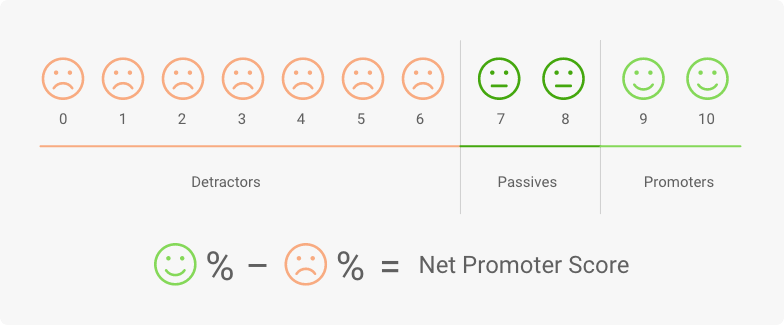
Net Promoter Score Calculation
NPS is a percentile of customers that refer the product to others. Counted from -100% to +100%, it shows how satisfied users are with the product. There are detractors that usually criticize the software, passive users that just use it but don’t recommend it, and promoters who are satisfied with the product and recommend it to others. By conducting an NPS survey, you can calculate the NPS and track it over time.
Customer satisfaction is usually evaluated in scores. For example, you’ve got 100 user responses. 15 of them are scored at 0-6 (these are detractors), 25 responses are in the 7-8 scores range (passives), and 60 responses in 9-10 (promoters). The NPS score will be 60% - 15% = 45%.
These KPIs for software development companies assess different quality aspects for both development processes and products, including reliability, performance, security, code quality, and programmer efficiency. Depending on the project type and your requirements, you may not need to track them all, or you may require other metrics for more accurate analysis. The primary purpose here is to select KPIs to help adjust the development process towards your business goals and achieve the end product's required quality.
Takeaways
Any control by itself is useless if it doesn't lead to improvements and doesn't help attain specific goals. There are multiple key performance indicators for software development that help optimize all processes for product success. The knowledge they provide is an excellent foundation for correct planning and strategic problem-solving at every development stage.
With the support of KeyUA’s software engineers and project management experts, you can gain the best possible results in balancing the development cost and quality, maximizing team performance within the given time frame. Correctly set KPIs also help ensure the end product quality and customer satisfaction, strengthening our clients’ reputation in the software market. If you’d like to get a top-grade software product with all potential risks controlled, KeyUA will be an excellent outsourcing partner to fulfill your development needs.
Set meaningful KPIs to control every stage of the software development process. Let’s attain top product quality together!
Get In Touch


 UA, Kyiv, Business Centre Gulliver

Comments
Leave a comment