
Data Mining has an enormous number of applications in the modern world. The amount of information has grown exponentially over time. The human brain is no longer capable of analyzing the rising volumes and extracting meaningful patterns. So we are turning to Data Mining and Big Data Analysis. For most people, Data Mining looks and sounds like a complicated and challenging concept to perceive. However, it has explainable Mathematical basics. Here is the list of Data Mining algorithms that provide unlimited power in extracting valuable hypotheses from unsorted and enormously large data arrays.
What is Data Mining Algorithms?
“Data Mining” interprets as in-depth and intellectual information analysis. It includes various methods of detecting previously unknown, non-trivial, and practical knowledge from the processed information. According to Microsoft, “An algorithm in data mining is a set of heuristics and calculations that creates a model from data.” The algorithm analyzes the provided data. The obtained results are further used for multiple iterations to find common parameters and build a mining model. Using this model, you can extract meaningful patterns and generate various statistics from the entire data set.
There are multiple methods of how to obtain this goal. Let’s elaborate on the TOPpopular data mining algorithms.
1. C4.5
C4.5 creates a classifier in the form of a decision tree. The algorithm implies the usage of a data set that already contains classified items.
For example, a data set contains information about a person’s age, weight, vitals, and habits, like eating junk food and exercising. These are attributes. Based on them, we can predict whether the person is fit or not. An individual is put into one of two classes: “fit” and “unfit.” The C4.5 algorithm receives a set of already classified information and then builds a decision tree that helps to predict the class of new items:
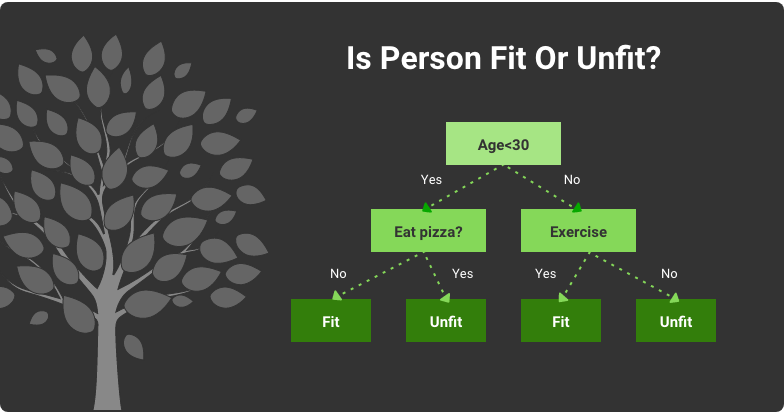
Classifying a Person’s Physical Fitness Using C4.5 Decision Tree
Based on the initial classified data set, the algorithm learns how to classify the upcoming information. Each value of attributes generates a new algorithm branch. All data items get an appropriate classification by moving through branches.
C4.5 is not self-learning but a supervised method. It is a comparatively simple data mining algorithm with clear interpretation and human-readable output.
Build robust data mining software tailored to meet all your business needs.
Contact Us2. Support Vector Machine (SVM)
The SVM method uses hyperplane to classify data into two categories. It performs similarly to C4.5. However, it doesn’t deal with decision trees.
A hyperplane is a function like y=ax+b (for the most straightforward variation, it is a line). SVM can project the analyzed data set into higher dimensions. Next, it finds the optimal hyperplane (usually not linear in more complex cases) that divides all data items into two classes.
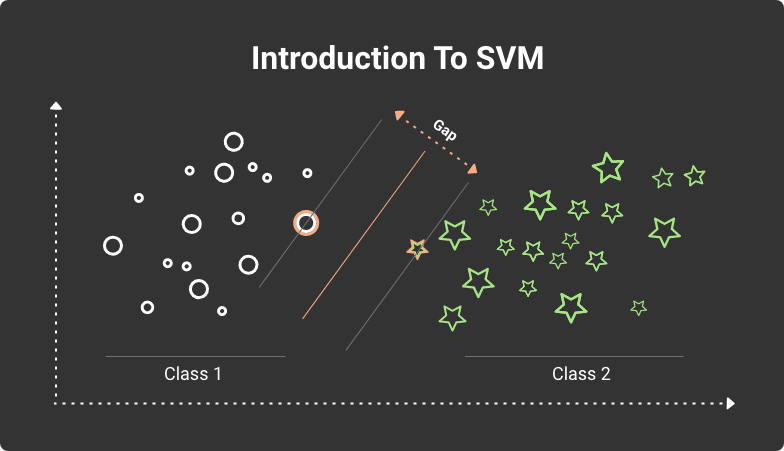
Classifying data items using SVM algorithm with a hyperplane
The most famous example that describes the Support Vector Machine method is a group of red and blue balls on the table. If they are not mixed, you can place a pool stick separating the red balls from the blue. Here the ball color is a class, and the stick is a linear function that divides the two groups of balls. The SVM algorithm calculates the position of the line that separates them.
When balls of different colors are mixed in a more complex situation, the linear function may not work. Then SVM can project the items into higher dimensions (hyperplane) to find the correct classifier.
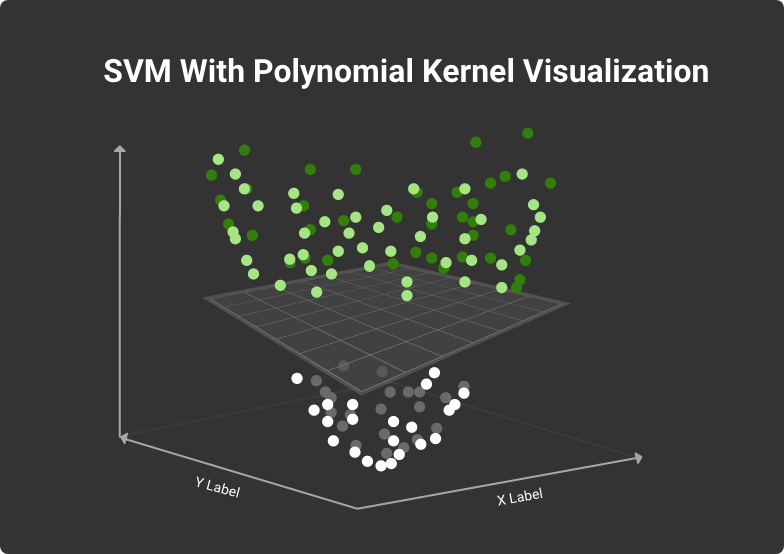
Projecting data items into higher dimensional space
If you consider plain visual data interpretation, each item (point) has two parameters (x,y). The more coordinates each dot has, the more dimensions the classifying hyperplane will have.
SVM is a supervised method, as it learns on the data set with defined classes for each item.
3. Apriori
Detecting association rules in big data arrays is highly popular among different types of data mining. Apriori is an unsupervised algorithm. It helps extract patterns for analyzing correlations and interrelations between other database variables.
Say you have a database with a set of all products sold in a supermarket. Each line in the table is a customer’s transaction, and you can see what items each customer bought. The Apriori algorithm defines what products are often purchased together and then uses it to improve the arrangement of goods to boost sales.
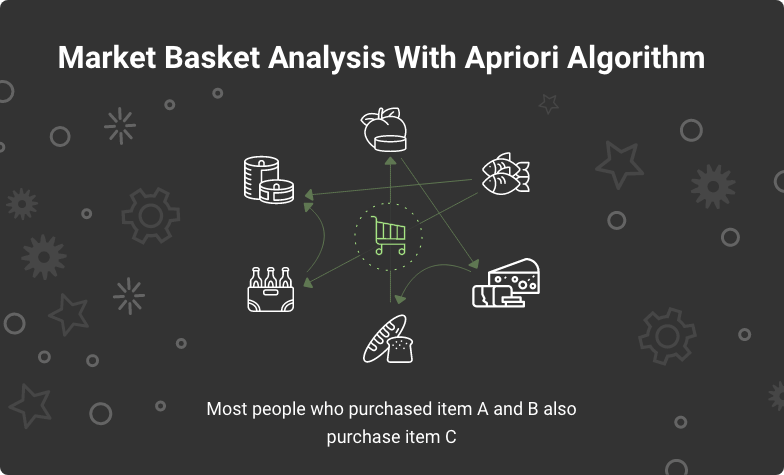
Apriori Data Mining algorithm in action
A pair of goods is a 2-itemset, for instance, chips and beer. Apriori calculates two parameters:
Support for each itemset: the number of times this itemset is present in the database.
Confidence for each item: the conditional probability that if a customer buys something, they will also buy another item from the given scope.
And the whole algorithm comes down to 3 steps:
Join: calculating the frequency of one itemset.
Prune: the itemsets that satisfy the target support and confidence move to the next iteration for 2-itemsets.
Repeat: the two steps are repeated for each itemset level until you sort out the scope’s required size.
4. K-Means
K-means is a group of cluster analysis techniques that create k groups of items that are more similar to each other than others. This method can be either unsupervised or semi-supervised.
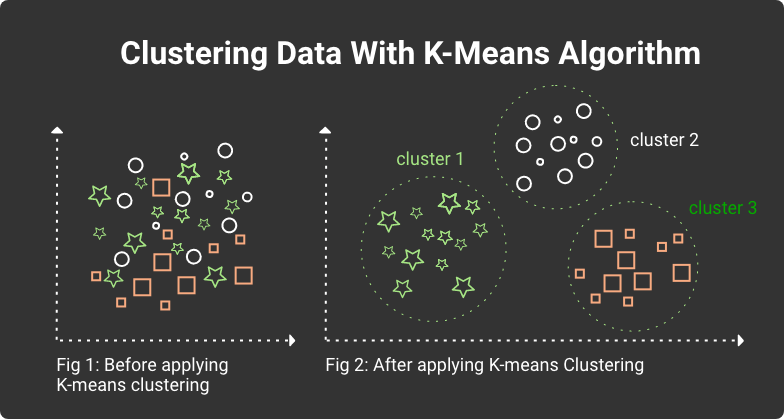
Clustering data with K-means algorithm
Each item's parameters are interpreted as coordinates in a multi-dimensional space, where each coordinate contains the value of one parameter. The whole set of parameter values represent an item vector. For instance, we have patient records with their age, weight, blood pressure, pulse rate, cholesterol, etc. And K-means can classify these patients by the combination of all these parameters. Here is how it works:
K-means picks a centroid for each cluster, i.e., a point in a multi-dimensional space.
Every patient will be located closest to one of these centroids, which forms a cluster around them.
K-means recalculates the center of each cluster based on its members. And this center becomes a new cluster centroid.
As all centroids change their positions, patients might be re-grouped around each centroid, like in step 2.
Steps 1-4 repeat until all centroids stay in place and patients don’t change their cluster membership. This state is called convergence.
5. Expectation-Maximization (EM)
Expectation-Maximization is one of the clustering examples of data mining algorithms for exploring meaningful patterns. By estimating a statistical model's parameters with undiscovered variables, this type of clustering algorithm assesses the highest likelihood of getting specific values.
The EM algorithm generates a Math model to predict how the newly gathered data will be distributed based on the provided data set. For instance, some university test results correspond to normal distribution. This division describes the probability of getting each of the possible outcomes. Model parameters, in this case, include mean (average value) and variance. The mean is 85, and the variance is 100 for the test results case. The entire distribution is described by the bell curve (normal distribution):
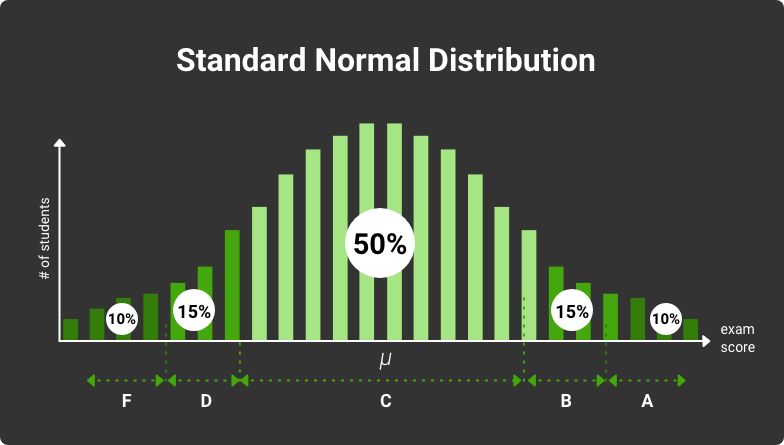
Exam grading curve: standard normal distribution
Say we have some number of exam scores, and we know only some part of them. We don’t have the mean and variance for all data points. We can estimate them using the known data samples and find the likelihood. It means the probability that a normal distribution curve with estimated mean and variance values will correctly describe all available test results (including those we don’t know).
Here is how EM helps in data clustering:
The algorithm tries to guess model parameters based on the given data.
E-step: it calculates each data point's probability belonging to the cluster.
M-step: it updates the model parameters.
The algorithm repeats Steps 2 and 3 until model parameters and cluster distribution becomes equal.
The EM is an unsupervised algorithm because it provides no labeled class data.
Empower your business with a first-class data mining app.
Contact Us6. PageRank
PageRank uses link analysis data mining algorithms to explore associations (links) between objects in a network. Google uses PageRank to define each web page's importance and show it in search results.
Many websites link to each other, and they all have their own ‘weight’ in a network. A website gets more votes if more pages link to it. So many sources consider it relevant and essential. And each page ranking is forming based on the class of linked websites.
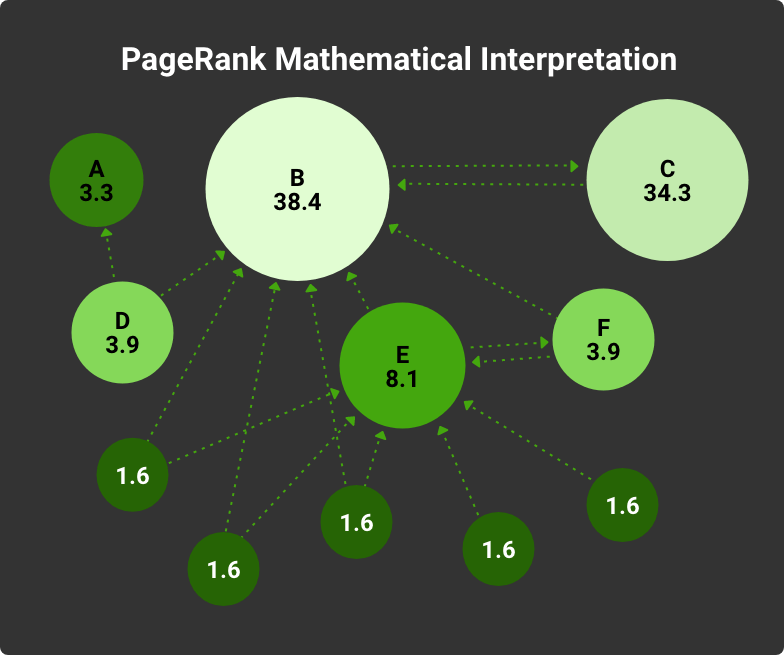
Calculating Page Weight Using PageRank
Google assigns the PageRank from 0 to 10, depending on the page’s relevancy and the number of inbound, outbound, and internal links. It is an unsupervised algorithm.
7. AdaBoost
AdaBoost is a method for boosting classifiers. A classifier analyzes some data set and then predicts the new category of the incoming elements.
Boosting is a learning algorithms aggregation. It is a mechanism that combines a few learning logics into one. Usually, these are a few weak learners that are assembled to create a strong one. A classic sample is a one-level decision tree, also known as a decision stump. Quite often, it’s not enough to know one single parameter value to classify the data correctly. If a few weak learners work together, they can form a robust model with higher accuracy. Here is what AdaBoost does:
It defines each weak learner's accuracy and finds the most vital result (this is the best learner) using the training data set.
A bigger weight is given to incorrectly classified data elements. They have higher chances to be classified in the following rounds. The best learner also gets their importance based on the number of correctly ranked items. It goes into the learners’ aggregation (currently, there is only one learner)
The sample data set mainly relies on incorrectly classified items. And AdaBosot defines the best learner, and it also goes into the aggregation.
After a certain number of rounds, we will have an array of trained (and re-trained) classifiers with high accuracy.
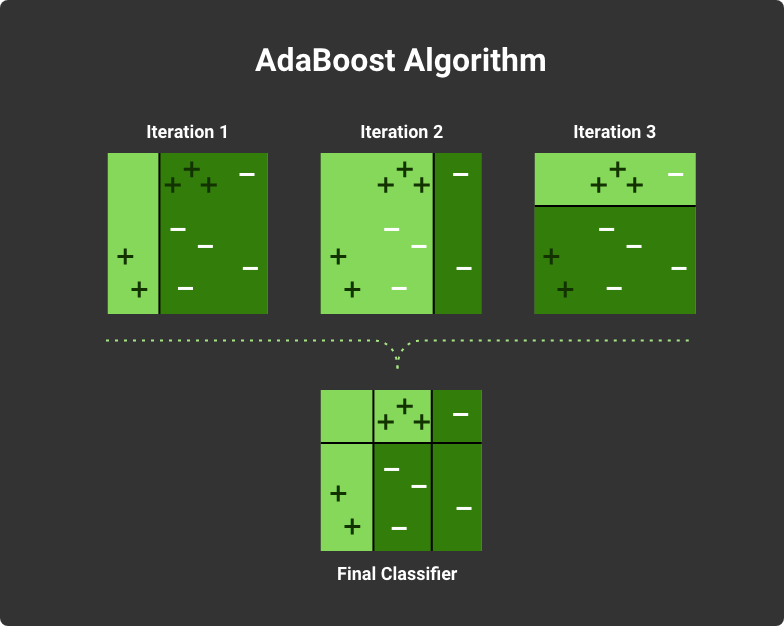
Boosting weak classifiers with AdaBoost
AdaBoost is a supervised algorithm because it trains learners on the labeled sample data set.
8. k-Nearest Neighbors (kNN)
The classifiers described above are active methods that generate the ranking model while learning. It trains the pattern with every new incoming data item. kNN algorithm represents a lazy learner — the one that does nothing except storing the training data set. It starts classifying only when new non-labeled items appear.
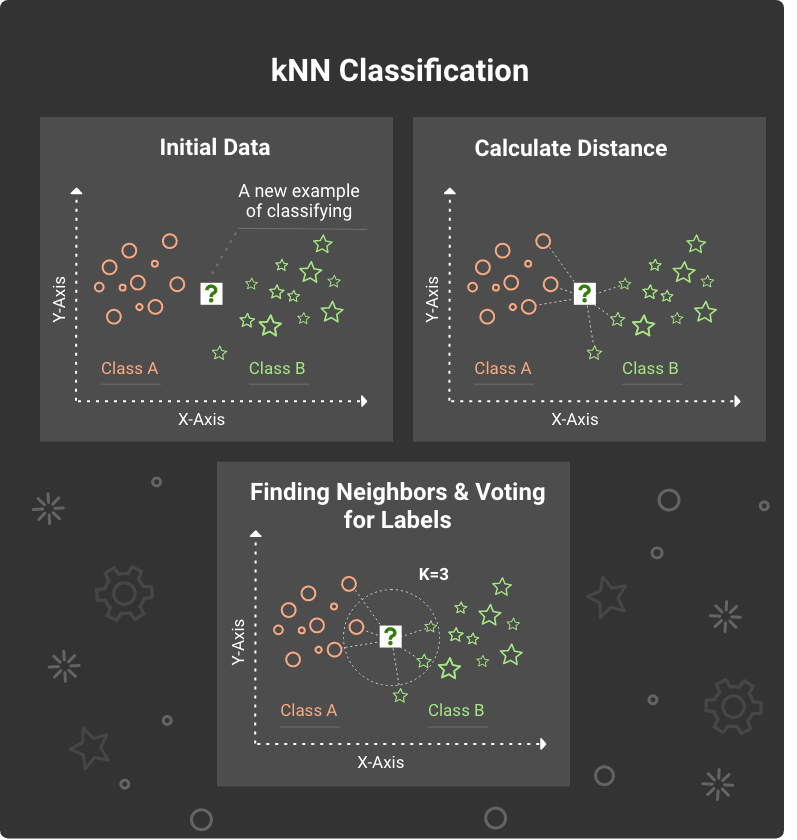
Classifying data with kNN algorithm
kNN doesn’t build any classifying model. When some non-labeled data comes in, kNN performs two steps:
It searches for k labeled data points nearest to the analyzed one (k nearest neighbors).
Using the neighbors’ classes, kNN decides what class it should assign to the analyzed data point.
This method also requires supervision. It learns from the labeled data set. It is straightforward and easy to implement and can achieve comparatively precise results.
9. Naive Bayes Algorithm
Naive Bayes algorithms use the assumption: each data parameter in the classified set is independent. Such an algorithm calculates the probability that a data point is Class A if it has Feature 1 and 2. The quotation for the likelihood of Class A is:

Basic formula for Naive Bayes Algorithm
P(Feature 1|Class A) gives the probability of feature to Class A
P(Feature 2|Class A) gives the probability of Feature 2 to class A
P(Class A) is a probability of class A
P(Feature 1) is the probability of Feature 1
P(Feature 2) is the probability of Feature 2
The algorithm is called ‘Naive’ because there are no such data sets with all independent features. It is just an assumption that is taken as a basis.
10. CART
CART means ‘classification and regression trees. This method generates either ranging or decision trees. Here a class is a tree output. It allows classifying data points like C4.5. A regression tree output is some numeric or continuous value, like some good’s price or the length of a tourist’s stay in a hotel.
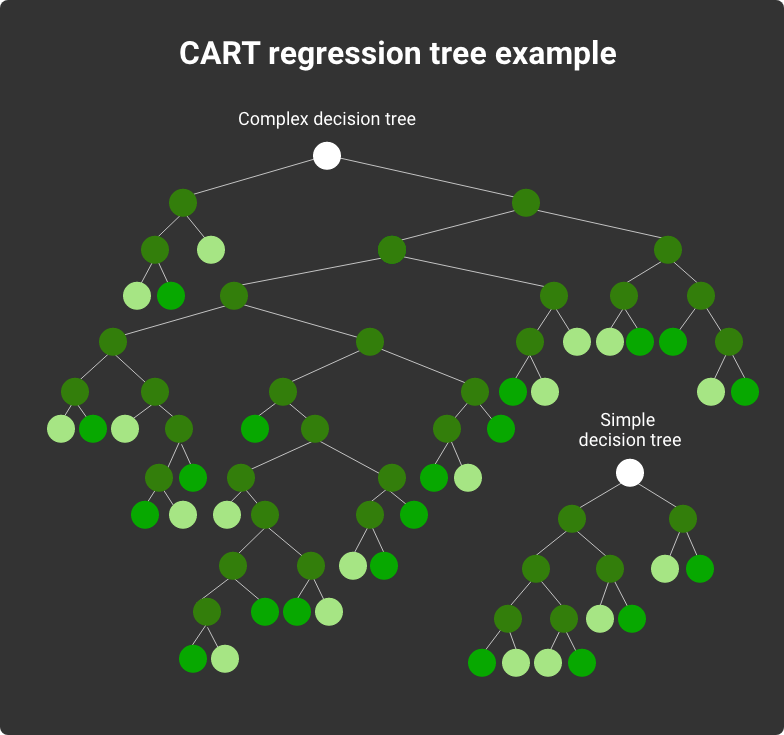
CART classification trees with binary branches
It is often considered a more advanced version of C4.5 that builds robust decision trees with binary branches. Each internal node always has two branches. The comparison of C4.5 and CART shows that CART works better with noisy data sets.
Final Thoughts
These are the TOP 10 data mining algorithms used to solve today’s data analysis and prediction challenges. The choice of a specific data mining approach depends on the character of analyzed data, the end goal, accuracy requirements, and business needs. It provides rich resources for competitiveness, company development, and science. If you’d like to know more about how to use data mining algorithms to solve your problems, discuss it with KeyUA data mining experts and software engineers. Applying different data mining, machine learning, and analytical approaches in practice, we unlock all the technologies' potential for your project.
Would you like to empower your project with robust data mining systems? Take your big data analysis to the next level with KeyUA.
Get In Touch


 Unit 1505 124 City Road, London, United Kingdom, EC1V 2NX

Comments
Leave a comment